
Watching a toy car zip down a ramp might seem like simple play, but it’s actually a perfect window into the fundamental laws of physics. This classic toy car going down a ramp experiment transforms everyday objects into powerful tools for understanding motion, energy, and the invisible forces that shape our world. Whether you’re a student preparing for a science project or a parent seeking an educational activity, mastering this experiment reveals how gravity, friction, and energy work together to create motion. In just 30 minutes with household materials, you’ll uncover principles that govern everything from roller coasters to vehicle safety design.
Why Your Toy Car Accelerates Down the Ramp
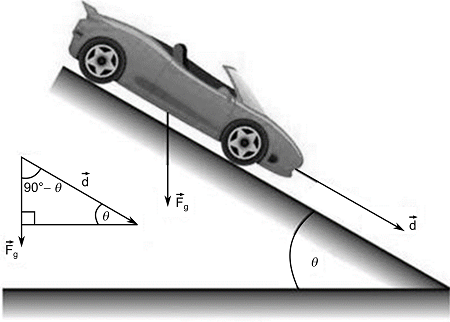
Gravity’s Role in Motion Creation
The moment you release a toy car at the ramp’s peak, gravity becomes the engine that powers its journey. This invisible force pulls the car downward, converting its elevated position into forward motion. The steeper your ramp, the more gravitational force acts along the ramp’s surface, creating faster acceleration. At a 45-degree angle, approximately 70% of gravity’s force contributes to forward motion while the rest presses the car against the ramp. For precise measurements, use a smartphone angle app to verify your ramp’s exact incline before each trial.
Energy Transformation Process Explained
Your toy car performs an elegant energy dance as it descends. At the starting line, 100% of its energy exists as potential energy—stored power based on its height above ground. As gravity pulls it downward, this potential energy transforms into kinetic energy—the energy of motion. In theory, the sum remains constant, but friction steals about 10-20% of this energy in real experiments. Pro Tip: Weigh your car first using a kitchen scale—this mass value (typically 30-100 grams for standard toy cars) is crucial for accurate energy calculations later.
Build Your Reliable Experiment Setup in 5 Minutes

Required Materials Checklist
- Toy car: Choose one with free-rolling wheels (Matchbox or Hot Wheels work perfectly)
- Ramp structure: Foam board, sturdy cardboard, or wooden plank (minimum 1 meter long)
- Protractor or smartphone angle app: For precise angle measurements
- Measuring tape: Metric measurements work best
- Stopwatch: Phone timer or dedicated stopwatch
- Masking tape: Mark start/stop points clearly
- Stackable books: For adjustable angle support
- Flat surface: Table or floor space extending beyond ramp base
Ramp Construction Steps That Prevent Common Errors
- Secure your base: Tape one end of your ramp material to a stable surface—wobbling ruins data accuracy
- Create angle support: Stack books or use adjustable objects to achieve desired angles (test 15°, 30°, 45°, and 60°)
- Add side rails: Fold up foam board edges or add cardboard strips to prevent derailment (critical for consistent results)
- Mark your track: Place tape at 10cm intervals for detailed measurements—these visual markers help spot acceleration changes
- Test stability: Ensure your ramp won’t shift during experiments—press down firmly on the support structure before each trial
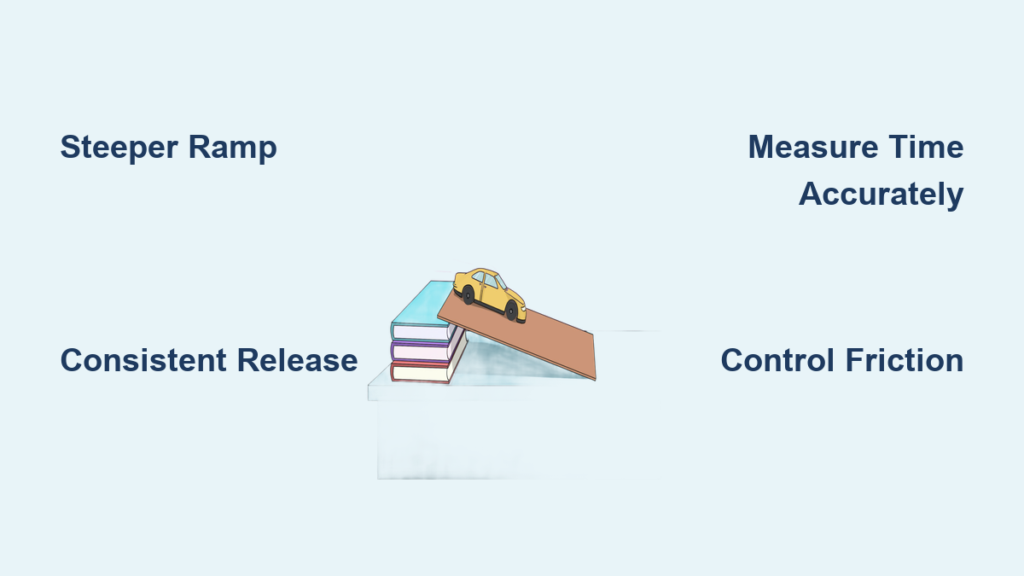
Control Variables Like a Physics Professional
What You Must Keep Constant for Valid Results
- Same toy car: Switching cars introduces new variables like wheel quality or weight distribution
- Release method: Never push—let gravity do all the work (inconsistent releases cause major timing errors)
- Starting position: Use a consistent release line or starting gate (mark with permanent tape)
- Environmental conditions: Avoid windy areas or uneven surfaces that affect motion
- Measurement technique: Same person timing, same measurement points (human reaction time varies by 0.2-0.3 seconds)
Variables Worth Testing for Meaningful Insights
- Ramp angles: Test 15°, 30°, 45°, and 60° for clear differences in acceleration
- Surface materials: Compare cardboard, wood, and plastic track sections to measure friction impact
- Car modifications: Add coins for weight or test different wheel types (document exact changes)
- Ramp lengths: Keep angle constant while changing total distance (reveals acceleration patterns)
- Starting heights: Maintain angle but adjust overall elevation (isolates height’s effect on speed)
Perfect Your Data Collection Process
Phase 1: Critical Baseline Measurements
Begin by understanding your car’s natural behavior. Roll it on a flat surface three times, measuring how far it travels. This establishes your wheel friction baseline. Next, weigh your car using a kitchen scale—typical toy cars range from 30-100 grams, and this mass directly affects your calculations. Warning: Skipping this step leads to inaccurate energy comparisons later.
Phase 2: Flawless Experimental Procedure
- Position your car: Place front wheels exactly at your marked starting line—consistency is key
- Steady your hand: Hold the car without applying forward pressure (test on flat surface first)
- Perfect timing: Start your timer the instant you release—practice this motion several times
- Consistent endpoint: Stop timing when the car’s front wheels cross your finish line (not the back wheels)
- Multiple trials: Repeat each configuration 5 times for reliable averages (reduces random error)
- Document everything: Record times, angles, and unusual observations (wobbling indicates alignment issues)
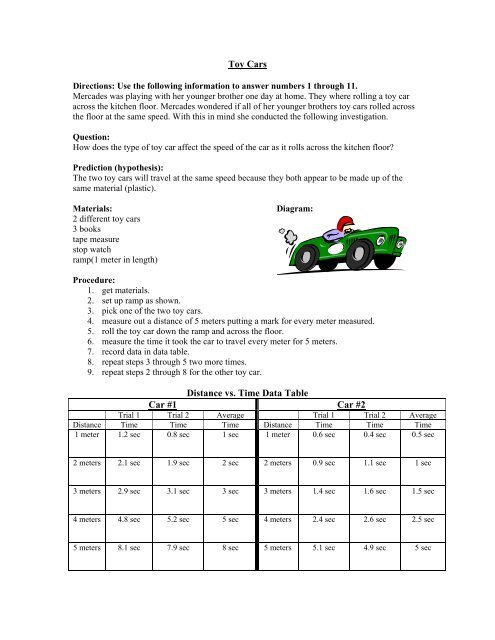
Phase 3: Organized Data Recording Tables
Create structured tables capturing:
– Trial number (1-5 minimum per configuration)
– Ramp angle in degrees
– Ramp length in centimeters
– Time to descend in seconds
– Distance traveled beyond ramp
– Notes on car behavior (wobbling, straight path, etc.)
Calculate Physics Values Without Complex Math
Velocity Calculations Made Simple
Find your car’s speed using basic formulas. Average velocity equals total distance divided by total time. For example, a 1-meter ramp completed in 2.5 seconds yields 0.4 meters per second. Final velocity at ramp bottom uses v = √(2gh), where g = 9.8 m/s² and h = vertical height. Pro Tip: For more accurate final velocity, measure the time it takes to travel the last 20cm of the ramp.
Acceleration Determination
Calculate how quickly your car gains speed. Average acceleration equals (final velocity – starting velocity) divided by time. Since your car starts from rest, simply divide final velocity by total time. A car reaching 2 m/s over 3 seconds accelerates at 0.67 m/s². Warning: Don’t confuse average velocity with acceleration—they’re fundamentally different physics concepts.
Solve Common Toy Car Experiment Problems
Timing Accuracy Issues That Skew Results
Eliminate human reaction time errors by using video recording. Film your experiments in slow-motion, then analyze frame-by-frame for precise timing. Alternatively, use smartphone apps that trigger timing based on motion detection. Mark your screen with tape overlays to ensure consistent measurement points. Pro Tip: Record 3 seconds before release and 3 seconds after for complete motion analysis.
Car Stability Problems That Derail Your Data
If your car veers off course, check wheel alignment by rolling it on a flat surface. Add guide rails using LEGO pieces or folded cardboard edges. Ensure your ramp surface is perfectly flat—warped cardboard creates unpredictable motion. Clean wheels and ramp surfaces to remove dust or debris affecting traction. Warning: Bent axles cause consistent directional bias—replace the car if this occurs.
Inconsistent Results Investigation Guide
Large variations between trials often indicate setup problems. Verify your ramp angle hasn’t shifted between trials. Check if your release technique varies—some people unconsciously give slight pushes. Examine your car for damage like bent axles or uneven wheels that could affect performance. Pro Tip: If standard deviation exceeds 15% of average time, investigate your setup before continuing.
Advanced Variations That Deepen Understanding
Friction Investigation Series
Transform your ramp into a friction laboratory. Cover sections with different materials—sandpaper increases friction dramatically while wax paper reduces it significantly. Test how wheel type affects performance by comparing rubber wheels versus plastic ones. Add graphite lubricant to axles and measure the improvement. Pro Tip: Calculate the coefficient of friction by finding the angle where the car just begins to slide on its own.
Mass Impact Studies That Challenge Assumptions
Explore how weight affects motion without changing car size. Tape coins to your car’s top, adding 5-gram increments between trials. Record whether heavier cars accelerate faster or slower. You’ll discover that in theory, mass shouldn’t affect acceleration, but increased weight does increase friction effects. Warning: Don’t add weight unevenly—center of mass shifts can cause unexpected behavior.
This experiment transforms simple play into profound scientific discovery. By carefully controlling variables and measuring results, you’re not just watching a toy car roll downhill—you’re witnessing the fundamental forces that govern everything from falling apples to orbiting satellites. Each measurement brings you closer to understanding the invisible physics shaping our universe. For your next project, try connecting your findings to real-world applications like vehicle safety design or roller coaster engineering—these connections make your toy car going down a ramp experiment truly come alive with relevance.